rlauxe
Georgia 2026 Primary OneAudit
07/13/2026
Ga2026Primary from manifests and candidate_totals
- only have candidate_totals from the two audited contests
- total cards in batches = 2,081,564
- very high undervote percentages ~ 50%, maybe because there are two cards and the contests are only on one of them ?? In which case the margins would be twice as big if there was card style data.
Batch Comparison Audit Summary
from final_audit_report.csv
- audited 2 contests with 341,816 ballots in 700 batches
- “US Senate - Rep” voteMargin 94110, margin = 0.0452, “Sample Size” = 138, Batches Sampled = 148
- “Governor - Dem” voteMargin = 406242, margin = 0.195, “Sample Size” = 18, Batches Sampled = 148
- risk limit 5%, batch comparison using arlo MACRO
- MACRO based on “Efficient Post-Election Audits of Multiple Contests: 2009 California Tests” Stark, Aug 2009
- “total ballots cast” = 2,081,564 agrees with sum of batches
- change in margin 91 (Senate) 40 (Gov)
Its not clear what “Sample Size” = 138 and 18 mean. There are 700 rows in the “SAMPLED BATCHES” section; summing the “Ballots in Batch” column gives 341,816. Perhaps 138 was the initial estimate, but there were multiple rounds and they ended up needing 700 batches? Perhaps the sample size is just ignored? Im not seeing this mentioned in Claude’s analysis. Maybe have to dig into the Arlo MACRO code.
Arlo should add an Above Threshold assertion for Governor - Dem contest
“Arlo treats this as a standard 1-winner contest: only candidate-pair hypotheses (Bottoms vs. each of 6 opponents) are tested, and the binding constraint is simply Bottoms vs. Esteves.”
I think that the “Above Threshold” assertion that Bottoms exeeded 50% should be tested. It has a margin of .065 and is the smallest margin for this contest. However, under the assumption that both contests appear on the same card together, this does not affect the sample size.
Rlauxe OneAudit summary
We have added the RUNOFF Social Choice Function to handle these contests.
We assume that the two contests appear on the same card, and appear on all cards. These assumptions minimize the sample size; we need card style data to make a more accurate simulation.
We use batch manifests and candidate totals to create a OneAudit pool for each batch, with subtotals for the two audited contests. The small size of these batches makes the OneAudit more efficient.
Running 100 audits, the range of mvr sample sizes (including overshoot) as a histogram:
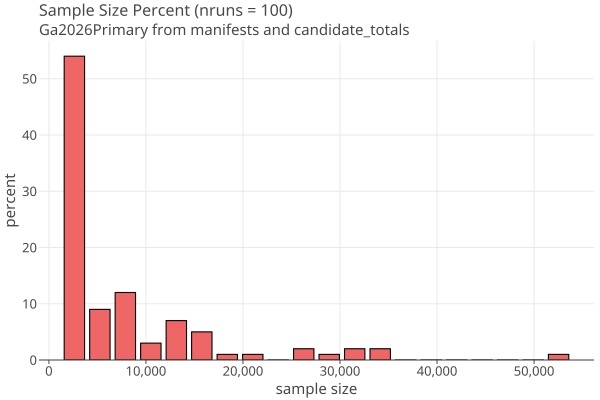
has a mean of 7646 and stddev = 9120. This is a highly skewed distribution with a long tail towards large sample sizes, likely typical of OneAudit distributions. It could be improved by reducing overshoot (ballots sampled but not needed).
The deciles of the CDF:
[10=1871, 20=2002, 30=2194, 40=2464, 50=3604, 60=5401, 70=7548, 80=12489, 90=16185, 100=53842] // 100 sims
[10=1823, 20=2100, 30=2354, 40=3385, 50=5480, 60=7328, 70=9720, 80=11667, 90=12299, 100=19820] // (prev, with cutoff)
Configuration has estPercentile=[50, 80], meaning use 50% decile for the first round, and 80% decile for subsequent rounds. This leads to “Number of rounds” histogram for the 100 trial runds:
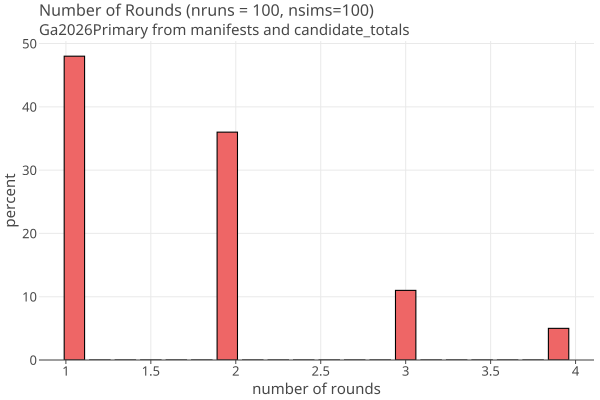
In conclusion, for this case, OneAudit has an average mvr sample size = 7646 « 341,816 for Batch Audit. But there is a long tail towards higher sample size.
Rlauxe Polling summary
Same as OneAudit, but as a polling audit.
Running 100 audits, the range of mvr sample sizes (including overshoot) as a histogram:
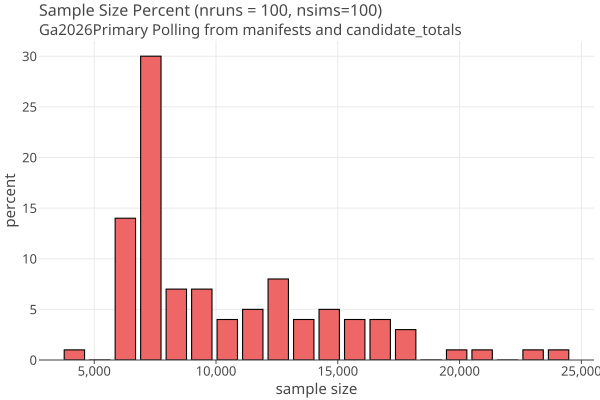
has a mean = 10380 and stddev = 4204.
The deciles of the CDF:
[10=6562, 20=6989, 30=7515, 40=7700, 50=8558, 60=10292, 70=12300, 80=14114, 90=16309, 100=24985]
[10=5686, 20=6882, 30=7488, 40=8210, 50=9488, 60=10434, 70=11702, 80=13403, 90=14852, 100=19904] // previous with cutoff
Configuration has estPercentile=[50, 80], meaning use 50% decile for the first round, and 80% decile for subsequent rounds. This leads to “Number of rounds” histogram for the 100 trial runds:
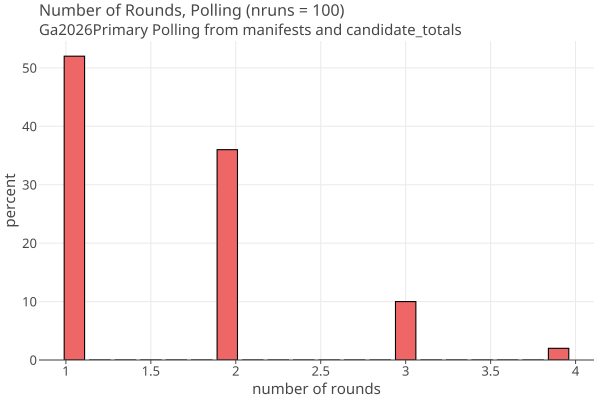
In conclusion, Polling has a 35% larger mean than OneAudit, but half the variance.
Compare with OneAudit paper
- BLCA: Batch-level comparison RLAs compare reported vote subtotals for randomly selected batches of cards (e.g., all cards cast in a precinct) to manual tabulations of the same batches
- BPA: Ballot-polling RLA examine individual randomly selected cards but do not use data from the voting system other than the totals
- CLCA: Card-level comparison RLAs compare individual CVRs to the corresponding MVRs for a random sample of cards
- OneAudit: CLCA where some or all CVRS are derived from contest or batch subtotals.
- Hybrid audits use different audit strategies in different strata.
  BLCA is closest to historical statutory audits, but requires larger sample
  sizes than other methods when outcomes are correct. BPA requires almost no
  data from the voting system. It is generally more efficient than BLCA, but
  its sample size grows approximately quadratically as the margin shrinks. The
  most efficient approach is CLCA, for which the sample size grows approximately
  linearly as the margin shrinks. But it requires the most information from the
  voting system: an exported CVR for every card and a way to link exported CVRs
  to the corresponding physical cards, without compromising voter privacy.

  When OneAudit CVRs are derived entirely from contest totals, the method is algebraically equivalent to BPA.
  When the CVRs are derived from batch subtotals, the method is far more efficient than BLCA
  and approaches the efficiency of ‘pure’ CLCA when the batches are sufficiently homogeneous.
Table 3 amended:
| Contest | turnout | batches | margin | sample size | K-M BLCA | Shangrla OneAudit |
Wald BP | BLCA/CLCA | Rlauxe OneAudit |
Rlauxe Polling |
|---|---|---|---|---|---|---|---|---|---|---|
| 2020 CA U.S. Pres | 17,785,667 | 21,346 | 28.7 % | ~178,000 | 26,700 | 70 | 72 | 381 | - | - |
| 2022 GA SoS | 3,909,983 | 12,968 | 9.2 % | > 231,000 | 103,300 | 1380 | 700 | 75 | - | - |
| 2026 GA Senate | 2,081,564 | 5,641 | 2.2 % | 341,816 | - | - | - | - | 7646, 9120 stddev | 10380, 4204 stddev |
The OneAudit paper does not report variance; it only reports the expected value, ie the mean. These results and the OneAudit paper show that OneAudit compares well against batch audits, even at small margins.
Ga2026Primary from ballot image audit (not finished)
from github/nealmcb/rla-review-arlo/2026-05-19-primary/reports/ballot_image_audit.md:
Georgia law requires that every ballot be digitally imaged as it passes through an optical
scanner. The ballot image audit takes those stored images and re-tabulates them independently,
then compares the re-tabulation against the original scanner results.

**File:** `Contest Results Comparison with County Breakout.xlsx` (released ~2026-06-28)
**Rows:** 30,895 data rows
**Columns:** County, ContestId, ContestName, DetailId, DetailName, OriginalCount, AuditCount, Difference
| Metric | Count | Notes |
|---|---|---|
| Unique contest names | 974 | Across all counties |
| County × contest pairs | 9,169 | The unit the spreadsheet actually tracks |
| Unique ContestIds | 132 | IDs 1–132; reused across counties (not globally unique) |
| Contests with ≥2 candidates | 473 | By unique contest name |
| Uncontested (1 candidate) | 498 | Slightly more than half of all named contests |
| Purely local contests (1 county only) | 498 | Coincidence with uncontested count |
| Multi-county contests | 476 | State, federal, judicial, legislative |
| State/federal contests (≥50 counties) | 40 | Statewide races |
my findings:
- extract github/nealmcb/rla-review-arlo/2026-05-19-primary/downloads/contest_results_comparison.xlsx to csv
pass 1
read 30895 rows (county x contest x candidate)
Counties 159
Unique Contest names = 972
noCandidates = 3 (removed)
Contests = 969
  singleCounty = 494
  multiCounty = 475

Uncontested = 499
Statewide = 40
pass 2: keep seperate by county, then combine when both the contest name and candidates match
CountyContests 1679
Contests = 1672
oneCandidate = 1004
singleCounty = 1289
multiCounty = 383
statewide = 40
pass 3: fix typos in contests and candidate names
CountyContests 1668
countNoCand = 7
Contests = 1661
singleCounty = 1281
multiCounty  =  380
Uncontested = 1000
Statewide = 40
pass 4 get rid of leading “For” see “For Judge Court of Appeals of Georgia”
Counties 159
CountyContests 1650
Contests = 1650
oneCandidate = 999
contested = 651
  singleCounty = 514
  multiCounty = 106
  statewide = 31
TODO
- Cant rely on unique Contest or Candidate names: started to hand correct discrepencies (need to automate)
- Need to integrate Contest Ids (not done yet)
- Cant match on contestName or Id; I used contest name and candidates to put multicounty contests together
- I removed 7 contests with no candidates
- 1650 is close(r) to the mysterious 1785 contests
TODO: fix issues and run audit simulation.
We need card style data to make an accurate simulation with 650 contests. We also want batch level subtotals, not county subtotals.
Downloaded files
Taken from “github/nealmcb/rla-review-arlo/2026-05-19-primary”
Generating the election
createGaElection using manifest.csv and candidate_total.csv (Only have two contests available)
java -classpath cases/build/libs/rlauxe-cases-0.10.2.0-uber.jar org.cryptobiotic.rlauxe.cli.CreateCaseData \
    -case ga26p -topdir "/home/you/wherever/cases/ga2026Primary" \
    -input "/home/you/wherever/github/nealmcb/rla-review-arlo/2026-05-19-primary/extracted"
createGa2Election using manifest.csv ballot image audit (1668 contests, 1000 uncontested)
TODO