rlauxe
Colorado Statewide election by Counties 2024
last updated 08/26/2026
- 4,746,866 cards cast (Colorado 2024 General Election) in 63 Counties.
- 723 contests, 5 < minMargin, 112 uncontested, 606 auditable contests
- no IRV
- Corla targeted 65 contests, and sampled 4897 sampled ballot cards.
- risk limit = 3%
- This report based on subtotals by County, with simulated CVRs
- Colorado Statewide election by Counties 2024
Colorado-RLA (Corla) uniform sampling
The Colorado RLA software uses a “Conservative approximation of the Kaplan-Markov P-value” from the “Gentle Introduction” and “Super Simple” papers for its risk measuring function and to estimate the number of samples needed for each contest in order to achieve the risk limit.
Corla chooses a targeted contest in each county to audit, and estimates the number of samples needed (aka estNmvrs) when doing uniform sampling (does not use Rivest’s consistent sampling). It uniformly samples estNmvrs cards (aka sheets) across all the cards in the county.
Independently, it chooses two statewide contests to audit, calculates estNmvrs, and uniformly samples across all the cards in the state.
Risk estimation for uniform sampling
(Provisional Assumption 1) Because the sampling is uniform for both county and state, provisionally we think that we can combine both county and state samples together.
We also think that we can estimate the risk level based on these samples for all contests, not just the targeted ones, aka opportunistic auditing.
We group the combined samples by county, based on which county the card was cast in. When a contest lies within a single county, the RLA is straightforwad, using the fully diluted margin:
dilutedMargin = (margin in votes) / (total ballot cards in the county)
(Provisional Assumption 2) When a contest lies within multiple counties, provisionally we think the following algorithm can be used: For each county that the contest is in, calculate the county sample rate as
countySampleRate = (number of samples in the county) / (total ballot cards in the county)
Then we find the minimum countySampleRate over all counties. Conceptually, for each county we randomly choose and discard extra samples, until all counties have the same sample rate. Now sum the number of remaining samples over all counties, and sum the total cards over all counties. This is the audit stratum for that contest. (Note that the countySample rates are independent of the contest, but the set of counties used depends on each contest). The contest diluted margin is
dilutedMargin = (margin in votes over all counties with the contest) /
                (total ballot cards in all counties with the contest)
Given the contest dilutedMargin and the number of samples in the contest’s stratum, calculate the estimated risk from the betting martingale as:
gamma = 1.03905
bet = 2/gamma    // aka the "maximum bet"
upper = 1 for plurality assorter

noerror = 1.0 / (2.0 - margin/upper)
payoff = 1.0 + bet * (noerror - 0.5)

risk = 1 / payoff ^ nsamples
or from the Kaplan-Markov formula:
payoff = 1.0 - margin/(2*gamma)
risk = 1 / payoff ^ nsamples
Notes:
- I think Kaplan-Markov is the Taylor series approximation of the betting mart. The approximation is quite good and gets better as the margin gets smaller.
- The betting mart is taken from the ALPHA paper, equation 10.
- See Audit.pValueApproximation() for Corla’s risk calculation. This is called from ReportRows.genSumResultsReport() which calls ComparisionAudit.riskMeasurement(). The inputs are read from the database, so not able to see what values they are using. TODO: get copy of ReportRows.genSumResultsReport() output if possible.
Rlauxe simulated consistent sampling for CORLA 2024
We want to compare how the current uniform sampling risk measurement compares with using consistent sampling and Card-style data (CSD) as described in the “More style, less work” paper.
We dont have CVRs available so we have to simulate them from the county vote subtotals, taken from tabulateCounty.csv. Unfortunately, these subtotals do not include undervotes or number of cards for each contest. So we estimate those as best we can, and hope that in the future we can work with the real CVRs, or at least county vote subtotals that include undervotes. We dont have CVRs available so we have to simulate them from the county vote subtotals, taken from tabulateCounty.csv. Unfortunately, these subtotals do not include undervotes or number of ballots for each contest. So we estimate those as best we can, and hope that in the future we can work with the real CVRs, or at least county vote subtotals that include undervotes.
The accuracy of the simulation depends on knowing what contests appear together on what cards. If we had CSD for each card in the county manifests, we could do a very accurate simulation even without the actual CVRs. To proceed, we examined the 5000 sampled MVRs, and created a list of CardStyles (i.e. the list of contests on the card) found there.
There were still quite a few small contests that did not appear on any of the MVRs, so we just assumed that in each county, there was a single card style for all these ophan contests. (This is surely wrong and needs to be revisited). For each county, we adjusted the number of counts of each CardStyle until the total vote counts were equal to the known county subtotals, and the number of cards matched the values given by the auditcenter.
Given these simulated CVRs, we ran the standard Rlauxe consistent sampling algorithm. The diluted margins in this case are substantially better than in the uniform sampling “no-CSD” case:
dilutedMargin = (margin in votes) / (total cards that contain the contest)
Furthermore, the consistent sampling is over the entire set of cards in all counties, and we dont have to worry about contests that span multiple counties.
The downside is that there is less “opportunistic sampling” in consistent sampling than for uniform samping. In consistent sampling, each contest has a canonical sequence of cards that must be used, in order to eliminate possible sampling bias. So opportunistic contests (ones not expicityle included in the audit) can only use samples until the canonical sequence is broken because a card in its sequene is not included in the sample. This differs from uniform sampling where all mvrs in the strata count in the risk measurement, even when they dont include the contest (per private conversation with Phillip Stark). each contest has a canonical sequence of ballots that must be used, in order to eliminate possible sampling bias.
So opportunistic contests (ones not expicitly targeted) can only use samples until the canonical sequence is broken because a card in its sequence is not included in the sample. This differs from uniform sampling where all mvrs in the strata count in the risk measurement, even when they don’t include the contest (per private conversation with Phillip Stark).
Results
Screenshot of the Viewer Tool used for running “what if” scenarios:
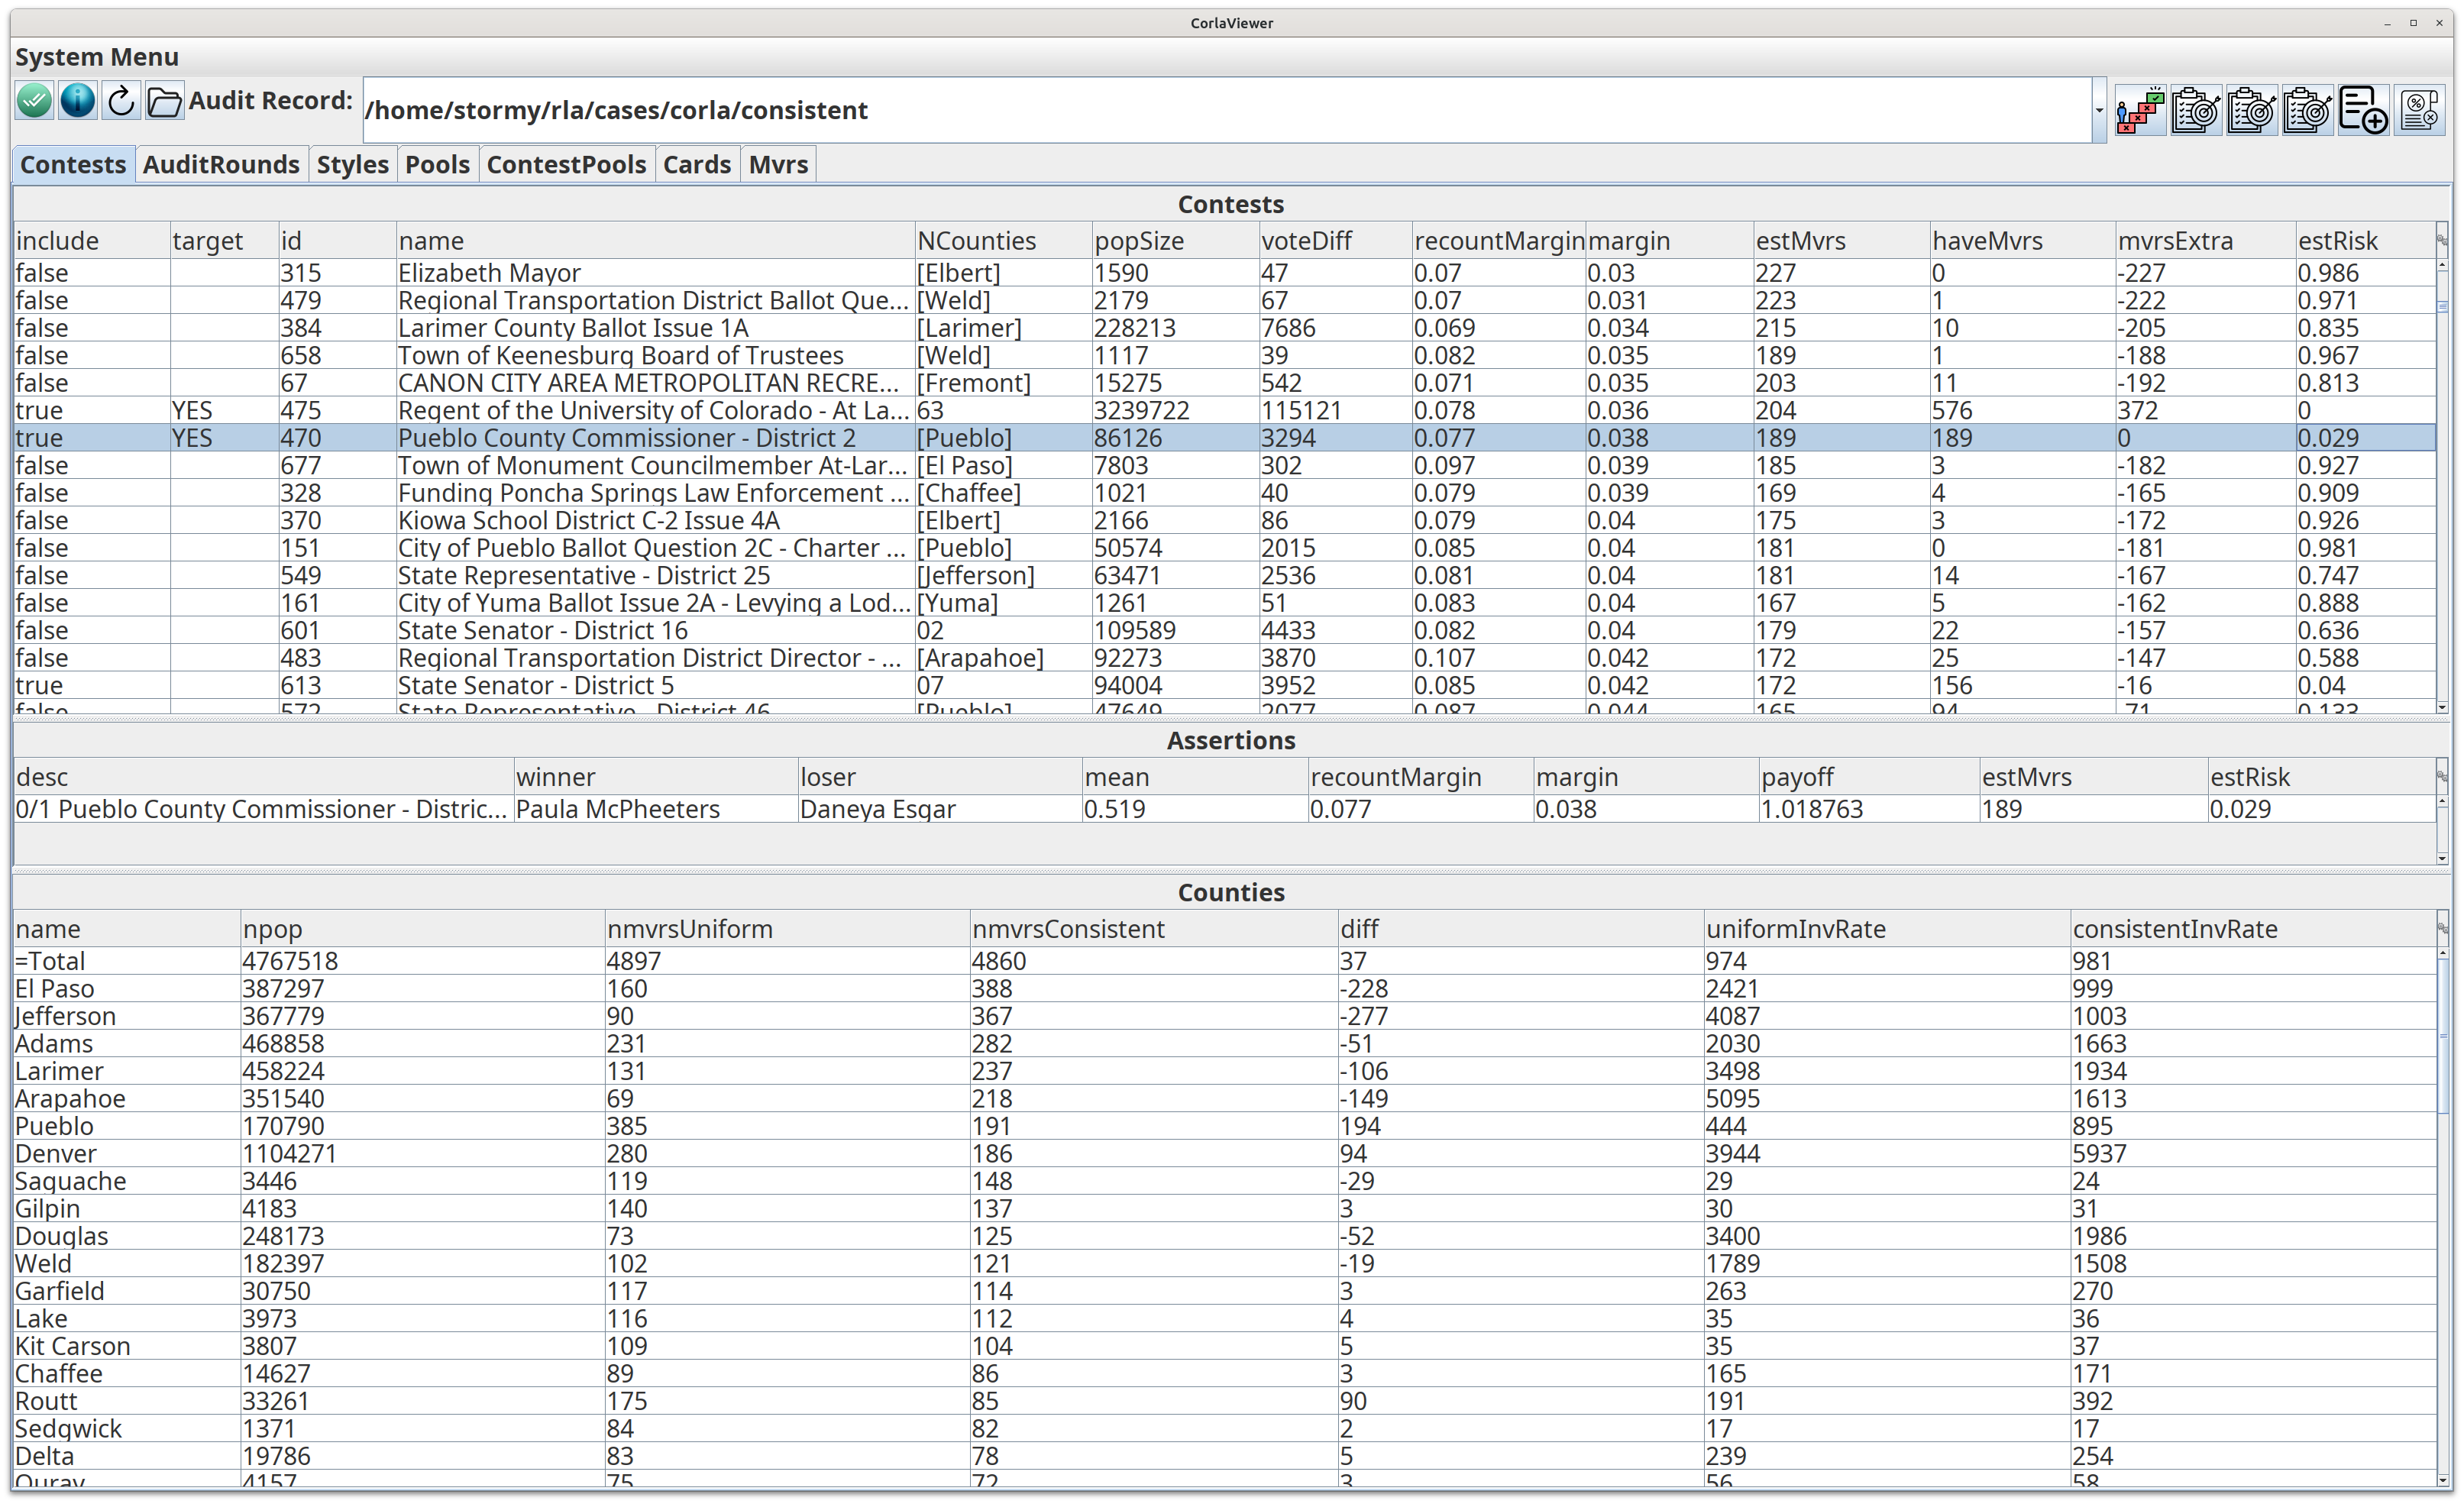
The following are plots of the distribution of all contests’ measured risk. The uniform sampling is the actual 2024 audit. The consistent sampling is our simulation, for different scenarios of which contests are selected to audit.
Targeted contests only
Here, the contests selected for auditing are only the targeted contests:
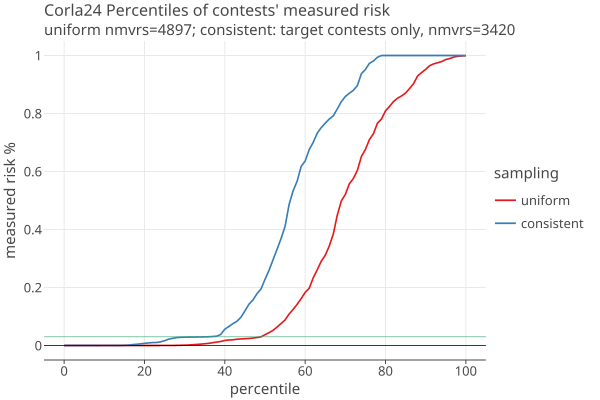
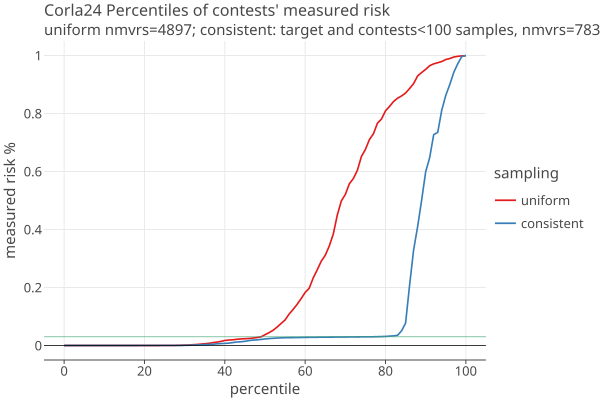
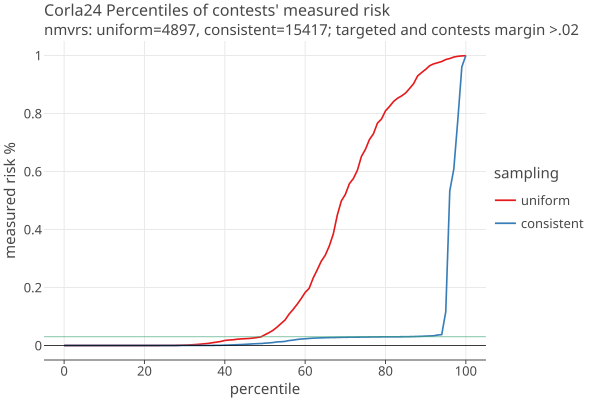
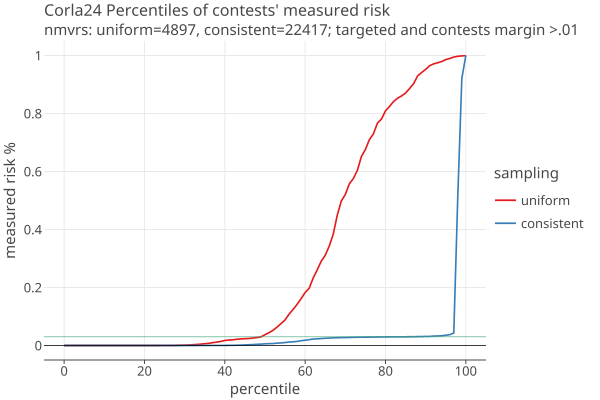
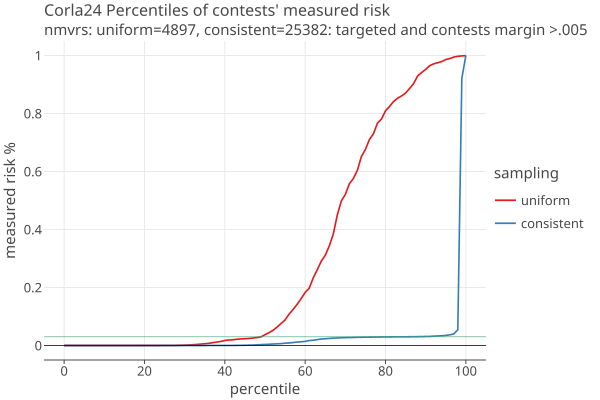
- The green line is the 3% risk limit.
- The percentile is the percent of contests with measured risk smaller than the y value of the plot.
- Consistent sampling has about 40% of the contests under the risk limit of 3%; uniform sampling close to 50%. This is still much greater than the percent of targeted contests = 65 / 723 = 9%.
- The uniform sampling shows better opportunistic sampling (distribution is pushed to the right)
- Note the number of total samples in each case: uniform = 4897, consistent = 3420.
Targeted contests plus important contests
The contests selected for auditing are the targeted contests plus all statewide contests and contests with names starting with “State” or “Representative”, needing less than 150 samples:
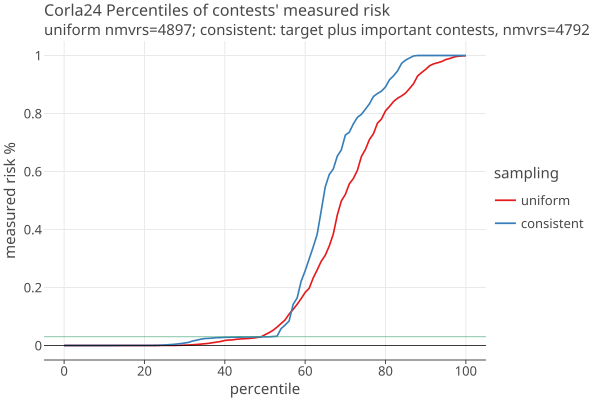
- Note the number of total samples: uniform = 4897, consistent = 4792. The 150 sample cutoff was chosen to make these approximately equal.
- The distributions are probably equivilent for practical purposes.
Targeted contests plus contests needing less than X samples
- The contests selected for auditing are the targeted contests plus all contests needing less than 35 samples:
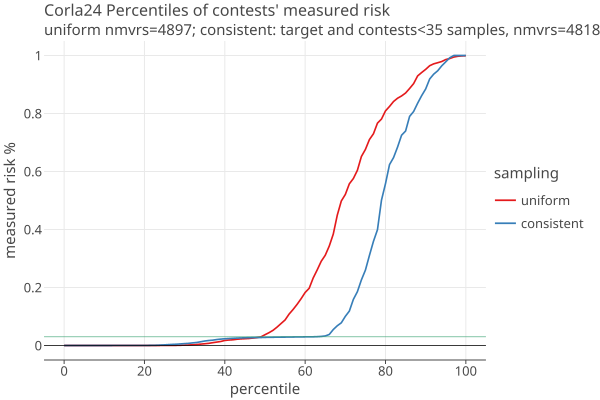
- Note the number of total samples: uniform = 4897, consistent = 4818. The 35 sample cutoff was chosen to make these approximately equal.
- The consistent sampling is quite a bit better, with over 65% of contests under the risk limit.
The contests selected for auditing are the targeted contests plus all contests needing less than 100 samples:
Targeted contests plus contests with margins greater than a cutuff
The next three plots have the targeted contests plus all contests with margins greater than 2%, 1% and 1/2%:
Incremental Costs of including close contests
Risk 3%
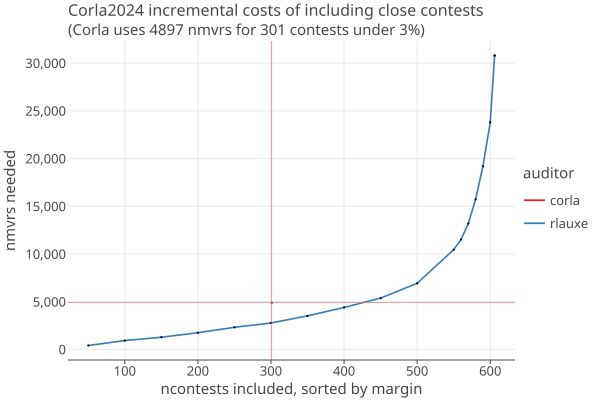
- The contests are sorted by descending margin
- The contests are added to the audit 50 at a time, then 10 at a time over 550.
- The steep rise at the end shows how the close contests sharply increase the samples needed.
- Corla has a single point shown in red.
- Not showing the average or variance here, just one example audit with simulated cvrs.
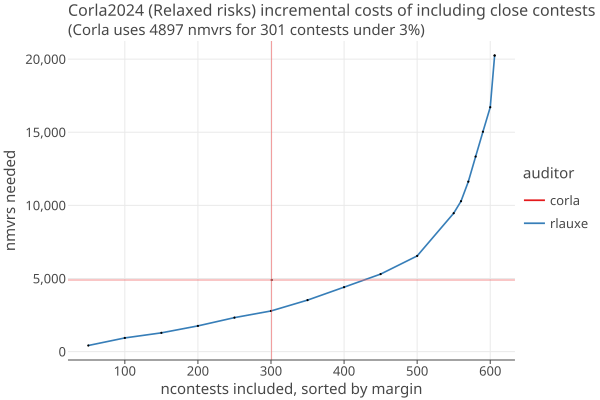
Relaxed Risk Same as above but with relaxed risk limits as the margins get smaller:
    if (contest estimated mvrs >= 250) max risk = 20 %
    else if (contest estimated mvrs >= 150) max risk = 10 %
    else if (contest estimated mvrs >= 50) max risk = 5 %
    else max risk = auditRiskLimit = 3%
Uniform vs Consistent Sampling
The last scenarios emphasize getting as many contests as possible under the limit. Yet these contests are probably the least interesting because they arent close. The advantage of consistent sampling is that one explicity chooses which contests to audit, then you see exactly what sample size is required. You can run “what if” scenarios until you are satisfied with the result and the cost.
If you have estimates of expected error rates, Rlauxe can model the expected variance of the samples needed. One can then choose a quantile of the distribution for the sample size, which gives the probability that you will need more than one round. So you can explicitly choose the tradeoff between extra samples vs the number of rounds needed.
County level sample size
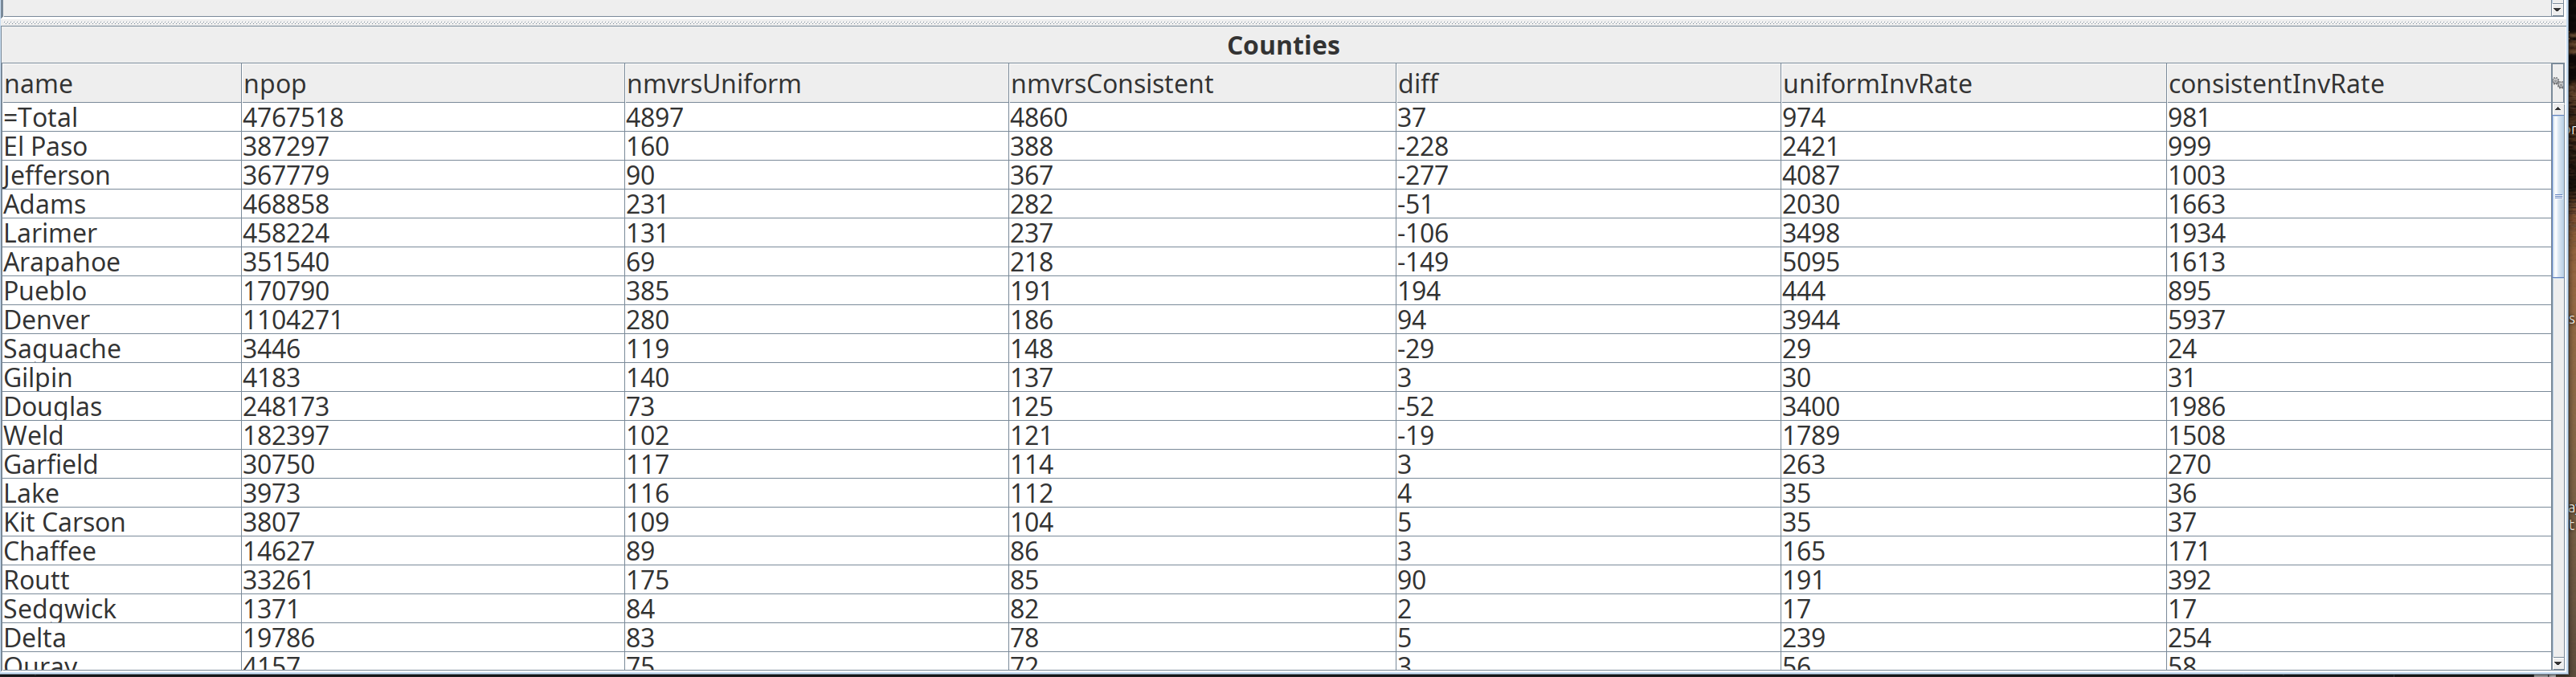
The number of samples needed can be shown by county. Each county might make its own choices of which contests to audit, and immediately see the variance of the number of samples the county would need to audit. It can iterate on these choices until satisfied with the cost and benefits.
Here is an example from the “targeted plus important contests” scenario, the column labeled nmvrsConsistent is the number of samples needed for each county (these reflect whether the county has close contests, not the size of the county):
CVRs vs Card Styles
In order to do consistent sampling we would like to have full access to CVRs (and they must record the undervotes). However, consistent sampling doesn’t actually need the CVR unless that card gets selected for the audit. What we do need is an accurate list of the contests that are on each card, aka the Card Style. I imagine that each county has a relatively small number of Card Styles, and if these were included on the manifest, we could do consistent sampling from that.
A publicly verifiable audit needs the CVRs to be publically commited to before the audit starts, to ensure that the election authority cant cheat on the audit. But if releasing the actual votes is impossible for now, then card styles in the manifest would be a good first step.